Video Games Sales Explore Dashboard
Power BI dashboard offers quick and easy interaction through drill-through, drill-down, and filtering techniques. The interaction is smooth and effective. This dashboard specifically focused on these techniques
Situation
The task was to create an interactive and informative dashboard that allows users to easily explore the video games sales data from different angles.
Task
Design a Power BI dashboard that leverages drill-through, drill-down techniques, and filtering to provide a detailed and user-friendly analysis of video game sales across various dimensions such as year, genre, platform, publisher, and region.
How to Use
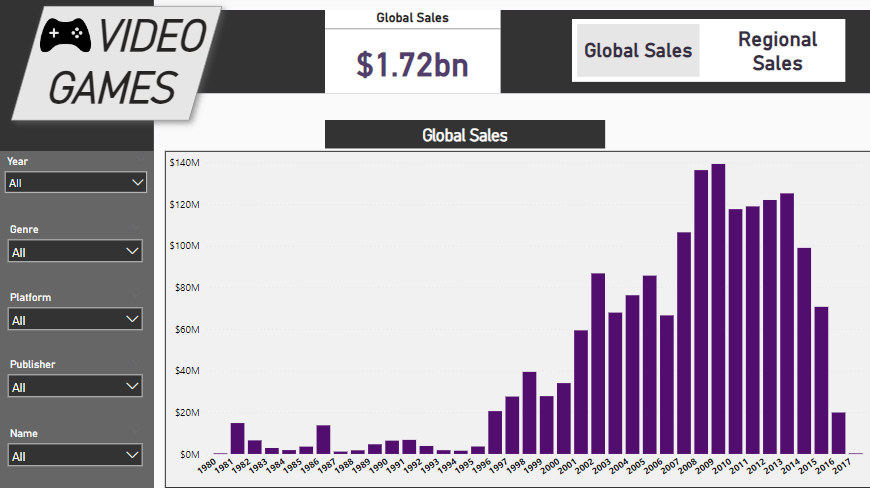
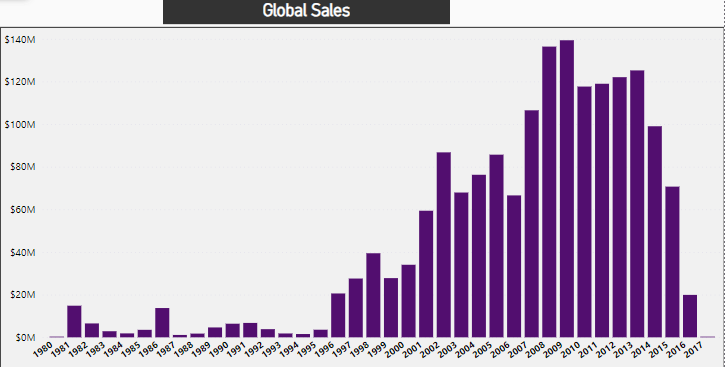
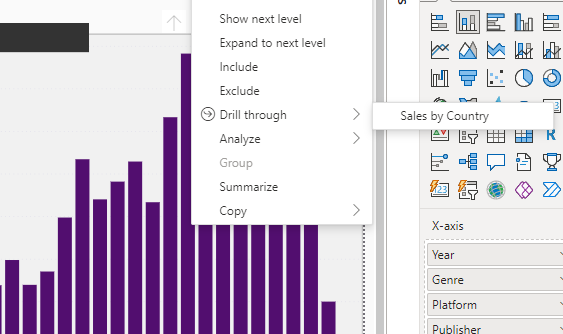
Start on the First Page A bar chart displaying video game sales by year is the first element. This chart is interactive, allowing deeper data exploration, such as genre, platform, and publisher. Clicking on a year updates the chart to show sales by genre, with further drill-down options for platform and publisher.
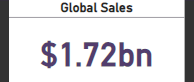
Global Sales Card The global sales card at the top dynamically updates to display total global sales based on the selections made. This card provides a quick view of overall sales figures for the drilled-down criteria.
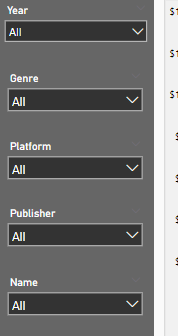
Go for The Filters On the side, a set of filters allows data refinement by year, genre, platform, publisher, or game name. Selecting any combination of filters narrows down the data further, with the chart and global sales card immediately reflecting these changes, focusing on specific areas of interest.
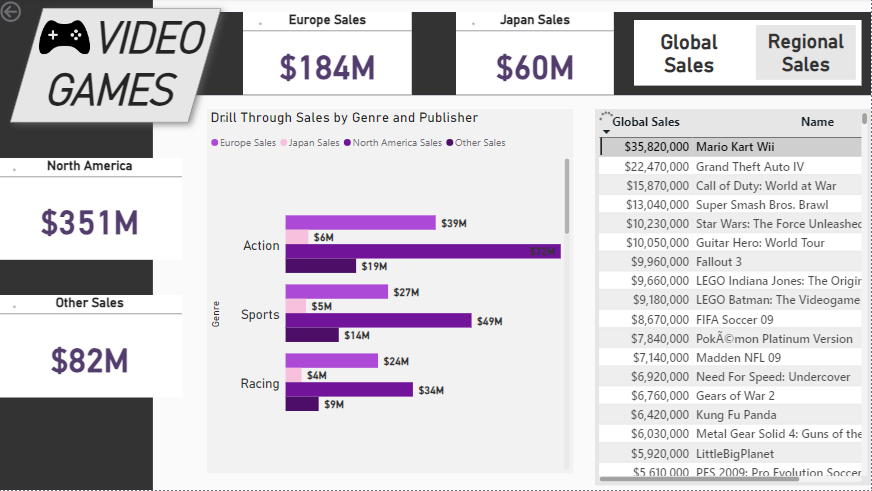
Drill Through to the Second Page After exploring the data on the first page, the drill-through option allows access to the second page for a regional breakdown of sales. Right-clicking on any data point in the bar chart and selecting the drill-through option navigates to a new page, where sales data is displayed by regions such as Japan, North America, Europe, and others.
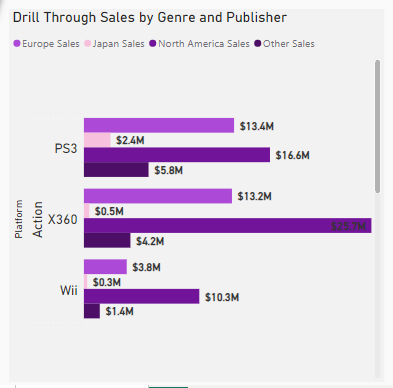
Explore Regional Sales The second page features a horizontal bar chart that shows sales by region, providing a clear comparison of sales performance across different regions by genre and platform with drill through.
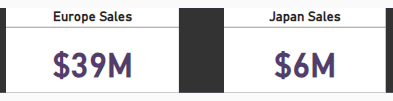
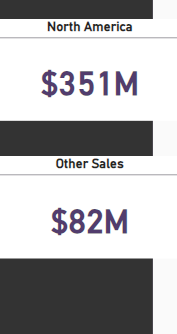
KPI Cards for Regional Sales There are four KPI cards represent sales figures for each region, offering a quick overview of how each region contributes to the overall sales.
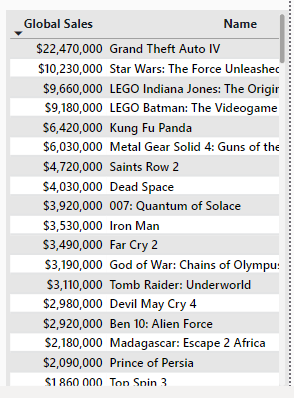
View Game-Specific Profits Finally, a table lists individual video games and their corresponding profits, providing valuable insights into which games are driving the most profit in each region.
Result
The project resulted in a highly interactive and easy-to-use dashboard. The drill-through and drill-down features, along with the filtering options, made it straightforward for users to analyze sales data from multiple perspectives, leading to more informed decision-making. The dashboard was well-received for its intuitive design and the seamless interaction between different data visualizations.